


FEATURE - High fleet angle
When your application requires severe displacement cable angles, Firstmark's 16x series transducer fitted with a RoundAbout meets the challenge.

Engineered Solutions
Shorten your development cycle and reduce design cost by working with Firstmark's Engineered Solutions team for your custom transducer needs.
feature - universal mount
Available on all 16x series position transducers, the universal base allows for infintively adjustable orientations in two axes.
 |
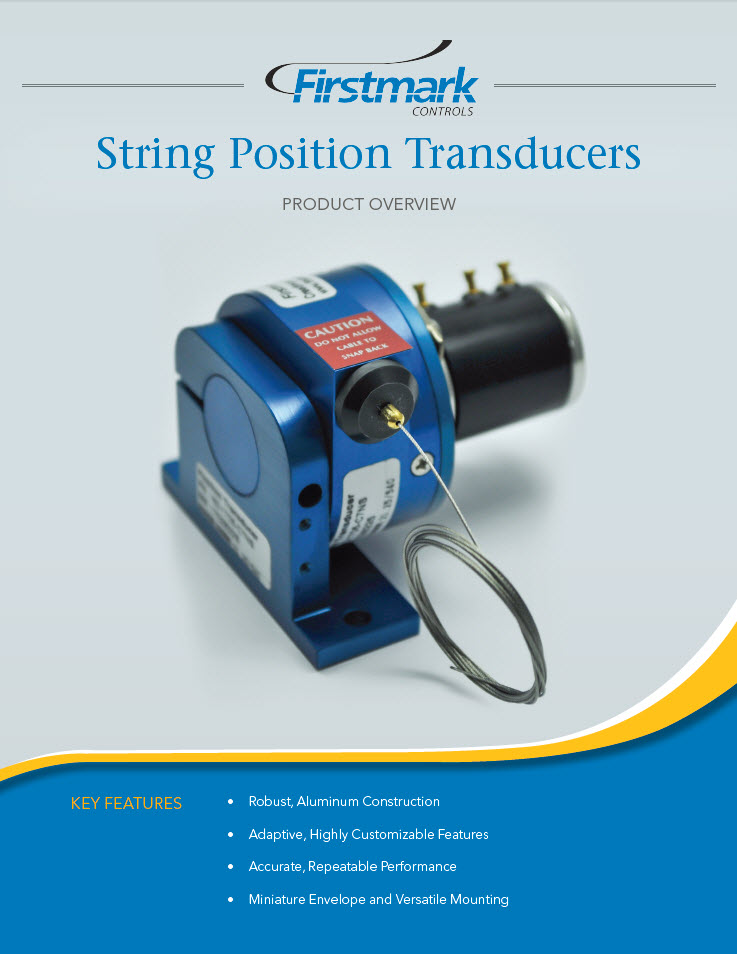
Firstmark Controls provides superior quality string position transducers for testing and OEM applications. With a proven legacy in the aviation, automotive, medical, space and general industry sectors, our rugged products have been serving the demanding needs of our customers since the 1970s. Beyond providing the most customizable product offering on the market, Firstmark's off-the-shelf aerospace grade transducers (15x, 16x and 17x) are all DO-160 rated and ready to be implemented in even the harshest conditions. |
|
Product Overview - String Pots |
|
landing pages Draw Wire YoYo String Pot cable actuated cable extension cable position
Firstmark Controls is a division of Firstmark Aerospace Corporation, an Ontic company. Firstmark is a AS9100D and ISO9001:2015 certified company.
© 1996-2023 Firstmark Controls All rights reserved.